Multiple Values TableThis Pine Script indicator, named "Multiple Values Table," provides a comprehensive view of various technical indicators in a tabular format directly on your trading chart. It allows traders to quickly assess multiple metrics without switching between different charts or panels.
Key Features:
Table Position and Size:
Users can choose the position of the table on the chart (e.g., top left, top right).
The size of the table can be adjusted (e.g., tiny, small, normal, large).
Moving Averages:
Calculates the 5-day Exponential Moving Average (5DEMA) using daily data.
Calculates the 5-week and 20-week EMAs (5WEMA and 20WEMA) using weekly data.
Indicates whether the current price is above or below these moving averages in percentage terms.
Drawdown and Williams VIX Fix:
Computes the drawdown from the 365-day high to the current close.
Calculates the Williams VIX Fix (WVF), which measures the volatility of the asset.
Shows both the current WVF and a 2% drawdown level.
Relative Strength Index (RSI):
Displays the current RSI and compares it to the RSI from 14 days ago.
Indicates whether the RSI is increasing, decreasing, or flat.
Stochastic RSI:
Computes the Stochastic RSI and compares it to the value from 14 days ago.
Indicates whether the Stochastic RSI is increasing, decreasing, or flat.
Normalized MACD (NMACD):
Calculates the Normalized MACD values.
Indicates whether the MACD is increasing, decreasing, or flat.
Awesome Oscillator (AO):
Calculates the AO on a daily timeframe.
Indicates whether the AO is increasing, decreasing, or flat.
Volume Analysis:
Displays the average volume over the last 22 days.
Shows the current day's volume as a percentage of the average volume.
Percentile Calculations:
Calculates the current percentile rank of the WVF and ATH over specified periods.
Indicates the percentile rank of the current volume percentage over the past period.
Table Display:
All these values are presented in a neatly formatted table.
The table updates dynamically with the latest data.
Example Use Cases:
Comprehensive Market Analysis: Quickly assess multiple indicators at a glance.
Trend and Momentum Analysis: Identify trends and momentum changes based on various moving averages and oscillators.
Volatility and Drawdown Monitoring: Track volatility and drawdown levels to manage risk effectively.
This script offers a powerful tool for traders who want to have a holistic view of various technical indicators in one place. It provides flexibility in customization and a user-friendly interface to enhance your trading experience.
스크립트에서 "moving averages"에 대해 찾기

OBV + Custom MA StrategyFor a long time, the use of the OBV indicator has been relatively monotonous, with its expression and content lacking diversity. Therefore, I'm considering trying new ways of representation.
This "OBV + Custom MA Strategy" indicator combines the On-Balance Volume (OBV) with customizable moving averages (SMA, EMA, or WMA) to provide advanced insights into market trends. The indicator calculates OBV manually and overlays two moving averages: a short-term and a long-term MA. Key features include:
OBV plotted alongside short-term and long-term moving averages for better trend visualization.
Signals generated when OBV crosses the short-term MA or when the short-term MA crosses the long-term MA.
Alerts for bullish and bearish crossovers to help identify potential buy or sell opportunities.
This indicator is suitable for traders looking to incorporate volume dynamics into their strategy while customizing their moving average type and periods.
中文说明
此“OBV + 自定义均线策略”指标结合了成交量指标OBV与可定制的移动均线(SMA、EMA或WMA),为市场趋势分析提供了更多的视角。该指标手动计算OBV,并叠加短期与长期均线,主要特点包括:
绘制OBV以及短期和长期均线,以更清晰地观察趋势。
当OBV上穿/下穿短期均线或短期均线上穿/下穿长期均线时,生成买卖信号。
提供多种看涨和看跌信号的警报,帮助识别潜在的买入或卖出机会。
此指标适合希望将成交量动态纳入策略的交易者,并支持自定义均线类型和周期以满足个性化需求。
Power Core MAThe Power Core MA indicator is a powerful tool designed to identify the most significant moving average (MA) in a given price chart. This indicator analyzes a wide range of moving averages, from 50 to 400 periods, to determine which one has the strongest influence on the current price action.
The blue line plotted on the chart represents the "Current Core MA," which is the moving average that is most closely aligned with other nearby moving averages. This line indicates the current trend and potential support or resistance levels.
The table displayed on the chart provides two important pieces of information. The "Current Core MA" value shows the length of the moving average that is currently most influential. The "Historical Core MA" value represents the average length of the most influential moving averages over time.
This indicator is particularly useful for traders and analysts who want to identify the most relevant moving average for their analysis. By focusing on the moving average that has the strongest historical significance, users can make more informed decisions about trend direction, support and resistance levels, and potential entry or exit points.
The Power Core MA is an excellent tool for those interested in finding the strongest moving average in the price history. It simplifies the process of analyzing multiple moving averages by automatically identifying the most influential one, saving time and providing valuable insights into market dynamics.
By combining current and historical data, this indicator offers a comprehensive view of the market's behavior, helping traders to adapt their strategies to the most relevant timeframes and trend strengths.

The Most Powerful TQQQ EMA Crossover Trend Trading StrategyTQQQ EMA Crossover Strategy Indicator
Meta Title: TQQQ EMA Crossover Strategy - Enhance Your Trading with Effective Signals
Meta Description: Discover the TQQQ EMA Crossover Strategy, designed to optimize trading decisions with fast and slow EMA crossovers. Learn how to effectively use this powerful indicator for better trading results.
Key Features
The TQQQ EMA Crossover Strategy is a powerful trading tool that utilizes Exponential Moving Averages (EMAs) to identify potential entry and exit points in the market. Key features of this indicator include:
**Fast and Slow EMAs:** The strategy incorporates two EMAs, allowing traders to capture short-term trends while filtering out market noise.
**Entry and Exit Signals:** Automated signals for entering and exiting trades based on EMA crossovers, enhancing decision-making efficiency.
**Customizable Parameters:** Users can adjust the lengths of the EMAs, as well as take profit and stop loss multipliers, tailoring the strategy to their trading style.
**Visual Indicators:** Clear visual plots of the EMAs and exit points on the chart for easy interpretation.
How It Works
The TQQQ EMA Crossover Strategy operates by calculating two EMAs: a fast EMA (default length of 20) and a slow EMA (default length of 50). The core concept is based on the crossover of these two moving averages:
- When the fast EMA crosses above the slow EMA, it generates a *buy signal*, indicating a potential upward trend.
- Conversely, when the fast EMA crosses below the slow EMA, it produces a *sell signal*, suggesting a potential downward trend.
This method allows traders to capitalize on momentum shifts in the market, providing timely signals for trade execution.
Trading Ideas and Insights
Traders can leverage the TQQQ EMA Crossover Strategy in various market conditions. Here are some insights:
**Scalping Opportunities:** The strategy is particularly effective for scalping in volatile markets, allowing traders to make quick profits on small price movements.
**Swing Trading:** Longer-term traders can use this strategy to identify significant trend reversals and capitalize on larger price swings.
**Risk Management:** By incorporating customizable stop loss and take profit levels, traders can manage their risk effectively while maximizing potential returns.
How Multiple Indicators Work Together
While this strategy primarily relies on EMAs, it can be enhanced by integrating additional indicators such as:
- **Relative Strength Index (RSI):** To confirm overbought or oversold conditions before entering trades.
- **Volume Indicators:** To validate breakout signals, ensuring that price movements are supported by sufficient trading volume.
Combining these indicators provides a more comprehensive view of market dynamics, increasing the reliability of trade signals generated by the EMA crossover.
Unique Aspects
What sets this indicator apart is its simplicity combined with effectiveness. The reliance on EMAs allows for smoother signals compared to traditional moving averages, reducing false signals often associated with choppy price action. Additionally, the ability to customize parameters ensures that traders can adapt the strategy to fit their unique trading styles and risk tolerance.
How to Use
To effectively utilize the TQQQ EMA Crossover Strategy:
1. **Add the Indicator:** Load the script onto your TradingView chart.
2. **Set Parameters:** Adjust the fast and slow EMA lengths according to your trading preferences.
3. **Monitor Signals:** Watch for crossover points; enter trades based on buy/sell signals generated by the indicator.
4. **Implement Risk Management:** Set your stop loss and take profit levels using the provided multipliers.
Regularly review your trading performance and adjust parameters as necessary to optimize results.
Customization
The TQQQ EMA Crossover Strategy allows for extensive customization:
- **EMA Lengths:** Change the default lengths of both fast and slow EMAs to suit different time frames or market conditions.
- **Take Profit/Stop Loss Multipliers:** Adjust these values to align with your risk management strategy. For instance, increasing the take profit multiplier may yield larger gains but could also increase exposure to market fluctuations.
This flexibility makes it suitable for various trading styles, from aggressive scalpers to conservative swing traders.
Conclusion
The TQQQ EMA Crossover Strategy is an effective tool for traders seeking an edge in their trading endeavors. By utilizing fast and slow EMAs, this indicator provides clear entry and exit signals while allowing for customization to fit individual trading strategies. Whether you are a scalper looking for quick profits or a swing trader aiming for larger moves, this indicator offers valuable insights into market trends.
Incorporate it into your TradingView toolkit today and elevate your trading performance!

Options Series - NonOverlay_Technical
⭐ 1. Purpose:
The script is designed to show technical indicators in a non-overlay form using candlestick representations. It combines multiple popular technical analysis tools to gauge the market's bullish or bearish conditions.
⭐ 2. Indicators:
The script uses several indicators across different timeframes: Exponential Moving Averages (EMA) for 5, 20, 50 periods. Simple Moving Average (SMA) for 200 periods. RSI (Relative Strength Index) for momentum. VWAP (Volume Weighted Average Price) for average price evaluation. PSAR (Parabolic SAR) for trend direction. Daily and multi-day (2-day and 3-day) data for broader market context.
⭐ 3. Candlestick Representation:
The script uses color-coded candlesticks to visually represent various indicators and their bullish/bearish states: Green candlesticks for bullish conditions. Red candlesticks for bearish conditions. Neutral/transparent for non-significant conditions.
⭐ 4. Important Conditions:
It calculates bullish and bearish conditions for each indicator: MA20: When the price is above or below the 20-period EMA. RSI: When RSI is above or below 50. VWAP: When the price is above or below the VWAP. PSAR: When the price is above or below the PSAR. 2-day and 3-day Moving Averages: Evaluating the broader trend.
⭐ 5. Bullish vs. Bearish Calculation:
The script sums up bullish and bearish signals to determine the overall market condition: Current_logical_bull: Counts the number of bullish indicators. Current_logical_bear: Counts the number of bearish indicators. The script compares these values to conclude whether the market is more bullish or bearish.
⭐ 6. Visual Plotting:
The script uses plotcandle to display the non-overlay signals at different levels for each condition, stacked vertically from MA20 to PSAR. Additionally, a master candle combines all indicators to show an overall market trend.
⭐ 7. Neon Effect on MA20:
It adds a neon-like effect to the MA20 line, making it visually prominent: A standard plot line with the base color. Two additional neon layers with increasing transparency to enhance the effect.
⭐ 8. Daily Timeframes and Lookahead:
The script fetches daily data using the lookahead feature to get a broader view of the market trend. It tracks the previous day’s and two days' data for comparison.
⭐ 9. Labels and Customization:
The script dynamically adds labels to the chart for the different plotted indicators at the last bar, making it easier to identify which indicator is being represented.
🚀 Conclusion:
The script combines multiple technical indicators, such as EMA, RSI, VWAP, PSAR, and multi-day moving averages, to visually assess bullish and bearish market conditions. It uses color-coded candlesticks to represent each indicator and sums up the signals to determine the overall trend.

Uptrick: Trend SMA Oscillator### In-Depth Analysis of the "Uptrick: Trend SMA Oscillator" Indicator
---
#### Introduction to the Indicator
The "Uptrick: Trend SMA Oscillator" is an advanced yet user-friendly technical analysis tool designed to help traders across all levels of experience identify and follow market trends with precision. This indicator builds upon the fundamental principles of the Simple Moving Average (SMA), a cornerstone of technical analysis, to deliver a clear, visually intuitive overlay on the price chart. Through its strategic use of color-coding and customizable parameters, the Uptrick: Trend SMA Oscillator provides traders with actionable insights into market dynamics, enhancing their ability to make informed trading decisions.
#### Core Concepts and Methodology
1. **Foundational Principle – Simple Moving Average (SMA):**
- The Simple Moving Average (SMA) is the heart of the Uptrick: Trend SMA Oscillator. The SMA is a widely-used technical indicator that calculates the average price of an asset over a specified number of periods. By smoothing out price data, the SMA helps to reduce the noise from short-term fluctuations, providing a clearer picture of the overall trend.
- In the Uptrick: Trend SMA Oscillator, two SMAs are employed:
- **Primary SMA (oscValue):** This is applied to the closing price of the asset over a user-defined period (default is 14 periods). This SMA tracks the price closely and is sensitive to changes in market direction.
- **Smoothing SMA (oscV):** This second SMA is applied to the primary SMA, further smoothing the data and helping to filter out minor price movements that might otherwise be mistaken for trend reversals. The default period for this smoothing is 50, but it can be adjusted to suit the trader's preference.
2. **Color-Coding for Trend Visualization:**
- One of the most distinctive features of this indicator is its use of color to represent market trends. The indicator’s line changes color based on the relationship between the primary SMA and the smoothing SMA:
- **Bullish (Green):** The line turns green when the primary SMA is equal to or greater than the smoothing SMA, indicating that the market is in an upward trend.
- **Bearish (Red):** Conversely, the line turns red when the primary SMA falls below the smoothing SMA, signaling a downward trend.
- This color-coded system provides traders with an immediate, easy-to-interpret visual cue about the market’s direction, allowing for quick decision-making.
#### Detailed Explanation of Inputs
1. **Bullish Color (Default: Green #00ff00):**
- This input allows traders to customize the color that represents bullish trends on the chart. The default setting is green, a color commonly associated with upward market movement. However, traders can adjust this to any color that suits their visual preferences or matches their overall chart theme.
2. **Bearish Color (Default: Red RGB: 245, 0, 0):**
- The bearish color input determines the color of the line when the market is trending downwards. The default setting is a vivid red, signaling caution or selling opportunities. Like the bullish color, this can be customized to fit the trader’s needs.
3. **Line Thickness (Default: 5):**
- This setting controls the thickness of the line plotted by the indicator. The default thickness of 5 makes the line prominent on the chart, ensuring that the trend is easily visible even in complex or crowded chart setups. Traders can adjust the thickness to make the line thinner or thicker, depending on their visual preferences.
4. **Primary SMA Period (Value 1 - Default: 14):**
- The primary SMA period defines how many periods (e.g., days, hours) are used to calculate the moving average based on the asset’s closing prices. The default period of 14 is a balanced setting that offers a good mix of responsiveness and stability, but traders can adjust this depending on their trading style:
- **Shorter Periods (e.g., 5-10):** These make the indicator more sensitive, capturing trends more quickly but also increasing the likelihood of reacting to short-term price fluctuations or "noise."
- **Longer Periods (e.g., 20-50):** These smooth the data more, providing a more stable trend line that is less prone to whipsaws but may be slower to respond to trend changes.
5. **Smoothing SMA Period (Value 2 - Default: 50):**
- The smoothing SMA period determines how much the primary SMA is smoothed. A longer smoothing period results in a more gradual, stable line that focuses on the broader trend. The default of 50 is designed to smooth out most of the short-term fluctuations while still being responsive enough to detect significant trend shifts.
- **Customization:**
- **Shorter Smoothing Periods (e.g., 20-30):** Make the indicator more responsive, better for fast-moving markets or for traders who want to capture quick trends.
- **Longer Smoothing Periods (e.g., 70-100):** Enhance stability, ideal for long-term traders looking to avoid reacting to minor price movements.
#### Unique Characteristics and Advantages
1. **Simplicity and Clarity:**
- The Uptrick: Trend SMA Oscillator’s design prioritizes simplicity without sacrificing effectiveness. By relying on the widely understood SMA, it avoids the complexity of more esoteric indicators while still providing reliable trend signals. This simplicity makes it accessible to traders of all levels, from novices who are just learning about technical analysis to experienced traders looking for a straightforward, dependable tool.
2. **Visual Feedback Mechanism:**
- The indicator’s use of color to signify market trends is a particularly powerful feature. This visual feedback mechanism allows traders to assess market conditions at a glance. The clarity of the green and red color scheme reduces the mental effort required to interpret the indicator, freeing the trader to focus on strategy execution.
3. **Adaptability Across Markets and Timeframes:**
- One of the strengths of the Uptrick: Trend SMA Oscillator is its versatility. The basic principles of moving averages apply equally well across different asset classes and timeframes. Whether trading stocks, forex, commodities, or cryptocurrencies, traders can use this indicator to gain insights into market trends.
- **Intraday Trading:** For day traders who operate on short timeframes (e.g., 1-minute, 5-minute charts), the oscillator can be adjusted to be more responsive, capturing quick shifts in momentum.
- **Swing Trading:** Swing traders, who typically hold positions for several days to weeks, will find the default settings or slightly adjusted periods ideal for identifying and riding medium-term trends.
- **Long-Term Trading:** Position traders and investors can adjust the indicator to focus on long-term trends by increasing the periods for both the primary and smoothing SMAs, filtering out minor fluctuations and highlighting sustained market movements.
4. **Minimal Lag:**
- One of the challenges with moving averages is lag—the delay between when the price changes and when the indicator reflects this change. The Uptrick: Trend SMA Oscillator addresses this by allowing traders to adjust the periods to find a balance between responsiveness and stability. While all SMAs inherently have some lag, the customizable nature of this indicator helps traders mitigate this effect to align with their specific trading goals.
5. **Customizable and Intuitive:**
- While many technical indicators come with a fixed set of parameters, the Uptrick: Trend SMA Oscillator is fully customizable, allowing traders to tailor it to their trading style, market conditions, and personal preferences. This makes it a highly flexible tool that can be adjusted as markets evolve or as a trader’s strategy changes over time.
#### Practical Applications for Different Trader Profiles
1. **Day Traders:**
- **Use Case:** Day traders can customize the SMA periods to create a faster, more responsive indicator. This allows them to capture short-term trends and make quick decisions. For example, reducing the primary SMA to 5 and the smoothing SMA to 20 can help day traders react promptly to intraday price movements.
- **Strategy Integration:** Day traders might use the Uptrick: Trend SMA Oscillator in conjunction with volume-based indicators to confirm the strength of a trend before entering or exiting trades.
2. **Swing Traders:**
- **Use Case:** Swing traders can use the default settings or slightly adjust them to smooth out minor price fluctuations while still capturing medium-term trends. This approach helps in identifying the optimal points to enter or exit trades based on the broader market direction.
- **Strategy Integration:** Swing traders can combine this indicator with oscillators like the Relative Strength Index (RSI) to confirm overbought or oversold conditions, thereby refining their entry and exit strategies.
3. **Position Traders:**
- **Use Case:** Position traders, who hold trades for extended periods, can extend the SMA periods to focus on long-term trends. By doing so, they minimize the impact of short-term market noise and focus on the underlying trend.
- **Strategy Integration:** Position traders might use the Uptrick: Trend SMA Oscillator in combination with fundamental analysis. The indicator can help confirm the timing of entries and exits based on broader economic or corporate developments.
4. **Algorithmic and Quantitative Traders:**
- **Use Case:** The simplicity and clear logic of the Uptrick: Trend SMA Oscillator make it an excellent candidate for algorithmic trading strategies. Its binary output—bullish or bearish—can be easily coded into automated trading systems.
- **Strategy Integration:** Quant traders might use the indicator as part of a larger trading system that incorporates multiple indicators and rules, optimizing the SMA periods based on historical backtesting to achieve the best results.
5. **Novice Traders:**
- **Use Case:** Beginners can use the Uptrick: Trend SMA Oscillator to learn the basics of trend-following strategies.
The visual simplicity of the color-coded line helps novice traders quickly understand market direction without the need to interpret complex data.
- **Educational Value:** The indicator serves as an excellent starting point for those new to technical analysis, providing a practical example of how moving averages work in a real-world trading environment.
#### Combining the Indicator with Other Tools
1. **Relative Strength Index (RSI):**
- The RSI is a momentum oscillator that measures the speed and change of price movements. When combined with the Uptrick: Trend SMA Oscillator, traders can look for instances where the RSI shows divergence from the price while the oscillator confirms the trend. This can be a powerful signal of an impending reversal or continuation.
2. **Moving Average Convergence Divergence (MACD):**
- The MACD is another popular trend-following momentum indicator. By using it alongside the Uptrick: Trend SMA Oscillator, traders can confirm the strength of a trend and identify potential entry and exit points with greater confidence. For example, a bullish crossover on the MACD that coincides with the Uptrick: Trend SMA Oscillator turning green can be a strong buy signal.
3. **Volume Indicators:**
- Volume is often considered the fuel behind price movements. Using volume indicators like the On-Balance Volume (OBV) or Volume Weighted Average Price (VWAP) in conjunction with the Uptrick: Trend SMA Oscillator can help traders confirm the validity of a trend. A trend identified by the oscillator that is supported by increasing volume is typically more reliable.
4. **Fibonacci Retracement:**
- Fibonacci retracement levels are used to identify potential reversal levels in a trending market. When the Uptrick: Trend SMA Oscillator indicates a trend, traders can use Fibonacci retracement levels to find potential entry points that align with the broader trend direction.
#### Implementation in Different Market Conditions
1. **Trending Markets:**
- The Uptrick: Trend SMA Oscillator excels in trending markets, where it provides clear signals on the direction of the trend. In a strong uptrend, the line will remain green, helping traders stay in the trade for longer periods. In a downtrend, the red line will signal the continuation of bearish conditions, prompting traders to stay short or avoid long positions.
2. **Sideways or Range-Bound Markets:**
- In range-bound markets, where price oscillates within a confined range without a clear trend, the Uptrick: Trend SMA Oscillator may produce more frequent changes in color. While this could indicate potential reversals at the range boundaries, traders should be cautious of false signals. It may be beneficial to pair the oscillator with a volatility indicator to better navigate such conditions.
3. **Volatile Markets:**
- In highly volatile markets, where prices can swing rapidly, the sensitivity of the Uptrick: Trend SMA Oscillator can be adjusted by modifying the SMA periods. A shorter SMA period might capture quick trends, but traders should be aware of the increased risk of whipsaws. Combining the oscillator with a volatility filter or using it in a higher time frame might help mitigate some of this risk.
#### Final Thoughts
The "Uptrick: Trend SMA Oscillator" is a versatile, easy-to-use indicator that stands out for its simplicity, visual clarity, and adaptability. It provides traders with a straightforward method to identify and follow market trends, using the well-established concept of moving averages. The indicator’s customizable nature makes it suitable for a wide range of trading styles, from day trading to long-term investing, and across various asset classes.
By offering immediate visual feedback through color-coded signals, the Uptrick: Trend SMA Oscillator simplifies the decision-making process, allowing traders to focus on execution rather than interpretation. Whether used on its own or as part of a broader technical analysis toolkit, this indicator has the potential to enhance trading strategies and improve overall performance.
Its accessibility and ease of use make it particularly appealing to novice traders, while its adaptability and reliability ensure that it remains a valuable tool for more experienced market participants. As markets continue to evolve, the Uptrick: Trend SMA Oscillator remains a timeless tool, rooted in the fundamental principles of technical analysis, yet flexible enough to meet the demands of modern trading.

AI-Powered Breakout with Advanced FeaturesDescription
This script is designed to detect breakout moments in financial markets using a combination of traditional breakout detection methods and adaptive moving averages. By leveraging elements of artificial intelligence, the script provides a more dynamic and responsive approach to identifying potential entry and exit points in trading.
Usefulness
This script stands out by integrating a traditional breakout finder with an adaptive moving average component. The adaptive moving average adjusts dynamically based on the differences between fast and slow exponential moving averages (EMAs), offering a more flexible and responsive detection of support and resistance levels. This combination aims to reduce false signals and enhance the reliability of breakout detections, making it a valuable tool for traders seeking to capture market movements more effectively.
Features
1. Breakout Detection: Utilizes pivot highs and lows to identify significant breakout points over a user-defined period. This method helps in capturing the essential support and resistance levels that are critical in breakout trading.
2. AI Machine Learning Component - Adaptive Moving Average: Implements an adaptive moving average using two exponential moving averages (EMAs). adaptiveMA is dynamically adjusted based on the difference between a fast average and a slow average.
3. Buy/Sell Signals: The script generates buy and sell signals when bullish and bearish breakouts occur, respectively. These signals are visually represented on the chart, helping traders to quickly identify potential trading opportunities.
4. Visualization: Draws horizontal lines at identified breakout levels and plots shapes (arrows) on the chart to indicate buy/sell signals. This makes it easy for traders to see where significant breakout points are and where to consider entering or exiting trades.
Underlying Concepts
1. Breakout Finder Logic: The script uses pivot points (highs and lows) to detect breakout levels. It stores these pivot points in arrays and monitors them for persistence, ensuring that the detected breakouts are significant and reliable.
2. Adaptive Moving Average (AMA): The AMA is a key component that enhances the script's responsiveness. By calculating the differences between fast and slow EMAs, the AMA adapts to changing market conditions, providing a more accurate measure of trends and potential reversals.
How to Use
• Adjustable Parameters: The script includes several user-adjustable parameters:
o Lookback Length: Defines the period over which the script calculates the highest high and lowest low for breakout detection.
o Multiplier for Adaptive MA: Adjusts the sensitivity of the adaptive moving average.
o Period for Pivots: Sets the period for detecting pivot highs and lows.
o Max Breakout Length: Specifies the maximum length for breakout consideration.
o Threshold Rate: Determines the threshold rate for breakout validation.
o Minimum Number of Tests: Sets the minimum number of tests required to validate a breakout.
o Colors and Line Style: Customize the colors and line styles for breakout levels.
Interpreting Signals
o Green Arrows: Indicate a bullish breakout signal, suggesting a potential buy opportunity.
o Red Arrows: Indicate a bearish breakout signal, suggesting a potential sell opportunity.
o Horizontal Lines: Show the breakout levels, helping to visualize support and resistance areas.
By combining traditional breakout detection with advanced adaptive moving averages, this script aims to provide traders with a robust tool for identifying and capitalizing on market breakouts.
Credits
Parts of this script were inspired and adapted from the "Breakout Finder" script by LonesomeTheBlue. Significant improvements include the integration of the adaptive moving average component and enhancements to the breakout detection logic.

GL LineIntroduction
The GL Line Indicator is a versatile tool designed to assist traders in identifying market trends by utilizing three different types of moving averages (EMA, SMA, VWMA) across multiple timeframes. This indicator provides a comprehensive view of market conditions, making it easier to spot potential trading opportunities.
Features
Multiple Moving Average Types:
Choose between Exponential Moving Average (EMA), Simple Moving Average (SMA), and Volume Weighted Moving Average (VWMA) for more tailored analysis.
Triple Timeframe Analysis:
Analyze trends across three different timeframes (Main, Secondary, Tertiary) to get a clearer picture of market direction.
Configurable Parameters:
Customizable lengths for fast and slow-moving averages. Adjustable ATR length and multiplier to refine trend detection sensitivity.
Visual Trend Indication:
Bullish and bearish trends are marked with color-coded lines and fills, enhancing visual clarity.
Confluence Table:
Optional confluence table that shows trend direction across the selected timeframes, aiding in decision-making.
How It Works
Main Trend Calculation:
Select the type of moving average and set the lengths for fast and slow MAs. The difference between these MAs, adjusted by the ATR multiplier, determines the trend direction.
Secondary and Tertiary Trends:
Similar calculations are done for secondary and tertiary timeframes, providing a broader market overview.
Trend Direction and Plotting:
The indicator plots the moving averages and fills the area between them with colors to denote bullish (green) and bearish (red) trends.
How to Use
Select Moving Average Type:
Choose between EMA, SMA, or VWMA based on your trading strategy.
Set Lengths and Multipliers:
Customize the lengths for the fast and slow-moving averages and adjust the ATR length and multiplier for better trend sensitivity.
Analyze Trends:
Use the color-coded plots and fills to identify market trends and make informed trading decisions.
Check Confluence Table:
Optionally display the confluence table to see trend directions across different timeframes.
Disclaimer
This indicator is designed to work best when the secondary and tertiary trends are set to higher timeframes than the chart's timeframe. Using higher timeframes for additional trends provides a broader market perspective and enhances the reliability of trend signals.

GL Gann Swing IndicatorIntroduction
The GL Gann Swing Indicator is a versatile tool designed to help traders identify market trends, support and resistance areas, and potential reversals. This indicator applies the principles of Gann Swing Charts, a technique developed by W.D. Gann, which focuses on market swings to determine the overall direction and turning points of price action. Gann Swing Charts are a time-tested method of technical analysis that simplifies price action by focusing on significant highs and lows, thereby eliminating market noise and providing a clearer view of the trend.
By analyzing price action and determining swing directions and turning points, the indicator filters out market noise using four distinct bar types:
Up Bar: Higher High, Higher Low
Down Bar: Lower High, Lower Low
Inside Bar: Lower High, Higher Low
Outside Bar: Higher High, Lower Low
This approach helps traders to:
Identify the primary trend direction.
Determine key support and resistance levels.
Recognize potential reversal points.
Filter out minor price fluctuations that do not affect the overall trend.
Features
Bar Types: Display bar types by checking the Show Bar Type box in the indicator's settings. Up bars appear as green upward-pointing triangles, down bars as red downward-pointing triangles, inside bars as grey circles, and outside bars as blue diamonds. These visual aids help traders quickly identify the type of bar and its significance.
Break Lines: These lines highlight when the price rises above a previous swing high or falls below a prior swing low. Green lines indicate breaks of swing highs, while red lines indicate breaks of swing lows. Break lines are enabled by default but can be turned off in the indicator's settings. Break lines provide visual confirmation of trend continuation or reversal.
Bar Count: Bar counts help determine if a swing is overextended and if a reversal is likely. This feature is off by default but can be enabled in the indicator's settings. Users can set a minimum bar count to focus on significant swings. Analyzing the number of bars in a swing can help traders gauge the strength and potential exhaustion of a trend.
Swing MA (Moving Averages): This feature plots the average of a user-defined number of previous swing highs and lows. Options are available to add two moving averages, allowing for both fast and slow averages. Swing MAs can be enabled in the indicator's settings. These moving averages smooth out the price data, making it easier to identify the underlying trend direction.
Why This Indicator is Useful
The GL Gann Swing Indicator is particularly useful for several reasons:
Trend Identification: By focusing on significant price swings, the indicator helps traders identify the primary trend direction, making it easier to align trades with the overall market movement.
Noise Reduction: The indicator filters out minor price fluctuations, allowing traders to focus on meaningful market movements and avoid being misled by short-term volatility.
Support and Resistance Levels: By highlighting key swing highs and lows, the indicator helps traders identify crucial support and resistance levels, which are essential for making informed trading decisions.
Potential Reversals: The indicator's ability to identify overextended swings and potential reversal points can help traders anticipate market turning points and adjust their strategies accordingly.
Customizability: With options to display bar types, break lines, bar counts, and swing moving averages, traders can customize the indicator to suit their specific trading style and preferences.
By incorporating Gann Swing principles, the GL Gann Swing Indicator offers traders a powerful tool to enhance their technical analysis, improve their trading decisions, and ultimately achieve better trading outcomes.

Uptrick:Intensity IndexPurpose:
The "Uptrick: Intensity Index" strategy is designed to provide traders with insights into the trend intensity of security by combining multiple moving averages and their relative positions. This versatile tool can be used effectively by both short-term and long-term traders to identify potential buy and sell signals based on specific conditions.
Explanation:
Input Parameters and Customization:
Moving Averages Lengths:
Adjust MA1, MA2, and MA3 lengths to change the calculation periods for the moving averages.
Trend Intensity Index SMA Length:
Adjust the length of the SMA applied to the TII.
Plot Colors:
Change the colors of the TII and TII MA plots for better visualization.
Background Colors and Transparency:
Set different colors for positive and negative TII MA values.
Control the transparency of the background color.
---------------------------------------------------------------------------
MA1 (Length 10): Short-term moving average, useful for capturing short-term market trends.
MA2 (Length 20): Medium-term moving average, providing a balanced view of market trends.
MA3 (Length 50): Long-term moving average, offering insights into long-term market trends.
The script calculates the relative positions of the closing price to each moving average (rel1, rel2, rel3) to determine how far the current price deviates from each average.
Trend Intensity Index (TII):
The TII is calculated as the average of the relative positions (rel1, rel2, rel3), multiplied by 100 to convert it into a percentage. This index reflects the overall intensity of the trend, considering short-term, medium-term, and long-term perspectives.
The TII is plotted in blue, providing a visual representation of trend intensity.
SMA of TII:
An additional SMA is applied to the TII (matii) to smooth out fluctuations and provide a clearer long-term trend signal.
The SMA of TII is plotted in orange, offering a reference for long-term trend analysis.
Determining Potential Price Movements:
For Short-Term Traders:
When the blue TII line crosses above the orange SMA of TII line, it indicates a potential buy signal.
When the blue TII line crosses below the orange SMA of TII line, it indicates a potential sell signal.
For Long-Term Traders:
When the orange SMA of TII line crosses above the highlighted 0 line, it indicates a potential buy signal.
When the orange SMA of TII line crosses below the highlighted 0 line, it indicates a potential sell signal.
Plotting and Visualization:
The TII and its SMA are plotted with distinct colors for easy identification.
A horizontal line at 0 is plotted in gray to serve as a reference point for long-term trend signals.
The background color changes based on the value of the SMA of TII (matii):
Green background for matii values above 0, indicating bullish conditions.
Red background for matii values below 0, indicating bearish conditions.
Utility and Potential Usage:
The "Uptrick: Intensity Index" indicator is a powerful tool for both short-term and long-term traders, offering clear buy and sell signals based on the crossover of the TII and its SMA, as well as the position of the SMA relative to the zero line.
By consolidating multiple moving averages and their relative positions into a single indicator, traders can gain comprehensive insights into market trends and intensity.
The ability to adjust all inputs and toggle visibility options enhances the flexibility and utility of the indicator, making it suitable for various trading styles and market conditions.
Through its versatile design and advanced features, the "Uptrick: Intensity Index" indicator equips traders with actionable insights into trend intensity and potential price movements. By integrating this robust tool into their trading strategies, traders can navigate the markets with greater precision and confidence, thereby enhancing their trading outcomes.
WHAT SETTINGS TO HAVE FOR THE MOVING AVERAGE:
Short-term traders (day traders) might prefer a shorter SMA length (e.g., 5-20 periods) as they are looking for quick signals and react to price changes more rapidly.
Medium-term traders (swing traders) might opt for a medium SMA length (e.g., 20-50 periods) which can filter out some noise and provide a clearer signal on the trend.
Long-term traders (position traders) might choose a longer SMA length (e.g., 50-200 periods) to get a broader view of the market trend and avoid reacting to short-term fluctuations.

Hull AMA SignalsThis script is a comprehensive trading indicator named "Hull AMA Signals", which combines AMA and HSO by LuxAlgo and ther video based strategy techniques to provide buy (long) and sell (short) signals. It overlays directly on the price chart, offering a dynamic and visually intuitive trading aid. The core components of this indicator are Adaptive Moving Averages (AMA), Hull Moving Average (HMA), and a unique Hull squeeze oscillator (HSO), each configured with customizable parameters for flexibility and adaptability to various market conditions.
Features and Components
Adaptive Moving Averages (AMA): This indicator employs two sets of AMAs, each with distinct lengths, multipliers, lags, and overshoot parameters. The AMAs are designed to adapt their sensitivity based on the market's volatility, making them more responsive during significant price movements and less prone to false signals during periods of consolidation.
Hull Moving Average (HMA): The HMA is calculated using a sophisticated algorithm that aims to reduce the lag commonly associated with traditional moving averages. It provides a smoother and more responsive moving average line, which helps in identifying the prevailing market trend more accurately.
Hull Squeeze Oscillator (HSO): A novel component of this indicator, the HSO, is designed to identify potential market breakouts. It does so by comparing the Hull Moving Average's direction and momentum against a dynamically calculated mean, generating bullish or bearish signals based on the crossover and divergence from this mean.
Buy (Long) and Sell (Short) Signals: The script intelligently combines signals from the AMA crossovers and the Hull squeeze oscillator to pinpoint potential buy and sell opportunities. Bullish signals are generated when there's a positive crossover in the AMAs accompanied by a bullish dot from the HSO, whereas bearish signals are indicated by a negative crossover in the AMAs along with a bearish dot from the HSO.
Customization and Style Options: Users have the ability to adjust various parameters such as the length of the moving averages, multipliers, and source data, enabling customization for different trading strategies and asset classes. Additionally, color-coded visual elements like gradients and shapes enhance the readability and instant recognition of trading signals.
Use Cases
Trend Identification: By analyzing the direction and position of the AMAs and HMA, traders can easily discern the prevailing market trend, helping them to align their trades with the market momentum.
Signal Confirmation: The combination of AMA crossovers and HSO signals provides a robust framework for confirming trade entries and exits, potentially increasing the reliability of the trading signals.
Volatility Adaptation: The adaptive nature of the AMAs and the dynamic calculation of the HSO mean allow this indicator to adjust to changing market volatility, making it suitable for a wide range of market environments.
This indicator is suitable for traders looking for a comprehensive and dynamic technical analysis tool that combines trend analysis with signal generation, offering both visual appeal and practical trading utility.

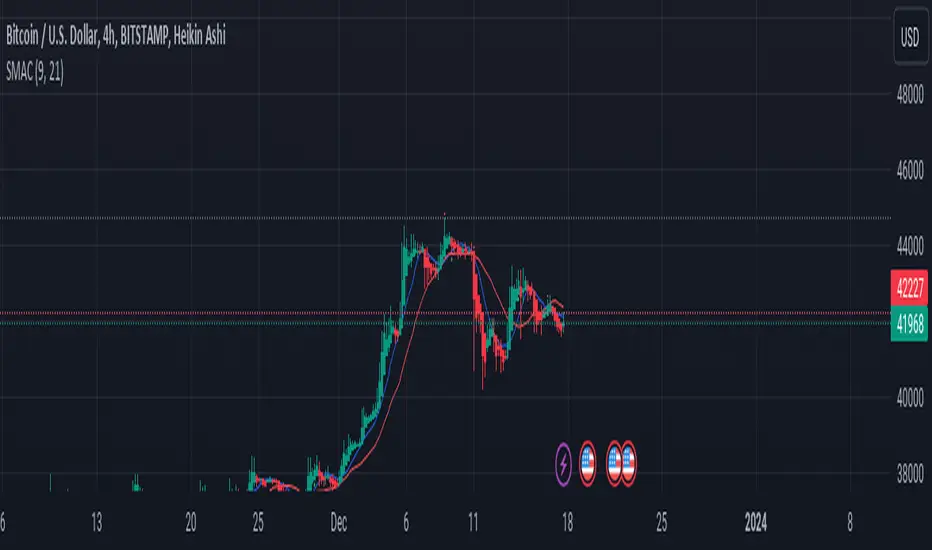
Simple Moving Average CrossoverThis Pine Script is a TradingView script for creating a technical analysis indicator known as a Simple Moving Average Crossover (SMAC). The script visualizes two moving averages on a chart and provides buy and sell signals based on the crossover of these moving averages.
Here's a breakdown of the script:
Input Parameters:
fastLength: The length of the fast/simple moving average.
slowLength: The length of the slow/simple moving average.
Moving Averages Calculation:
fastMA: Calculates the simple moving average with a length of fastLength using the closing prices.
slowMA: Calculates the simple moving average with a length of slowLength using the closing prices.
Plotting:
Plots the fast and slow moving averages on the chart using different colors.
Buy and Sell Signals:
buySignal: Generates a boolean series indicating a buy signal when the fast moving average crosses above the slow moving average.
sellSignal: Generates a boolean series indicating a sell signal when the fast moving average crosses below the slow moving average.
Plotting Signals:
Plots green triangle-up shapes below price bars for buy signals.
Plots red triangle-down shapes above price bars for sell signals.
In summary, this script helps traders visualize potential trend reversals by identifying points where a shorter-term moving average crosses above (buy signal) or below (sell signal) a longer-term moving average. These crossover signals are often used in trend-following strategies to capture potential changes in market direction. Traders can customize the script by adjusting the input parameters to suit their trading preferences.
Webby's Quick & Grateful Dead RSWebby's Quick & Grateful Dead RS combines a Relative Strength Line and Moving Averages to help traders hold a core position in a winning stock by identifying moments of strength and weakness in a stocks advance.
The Relative Strength (RS) line is something many investors are familiar with. It is used to measure a stocks performance versus the S&P 500 (default setting) and is typically calculated by dividing the closing price of the stock by the closing price of the S&P. This means if a stock moves up and the S&P moves down or the stock moves up more than the S&P the RS line will increase, if the stock moves down while the S&P moves up the line will decrease.
While the RS Line by itself is a powerful tool, adding moving averages to the RS line can help better understand trends. This work was done by Mike Webster (Webby) as he tried to reverse engineer how William O'Neil was able to hold some of his biggest winning positions.
This indicator plots the RS line along with two moving averages and clearly labels and alerts the 3 signals shared by Webby:
Quick Break - RS line crosses below the fast moving average
Quicksand - RS line moves lower than it was at the time of the Quick Break
Grateful Dead Break - RS line crosses below the slow moving average
To ensure your chart doesn't get skewed, please use the multiplier in the setting to adjust the vertical offset of the RS line and moving averages.

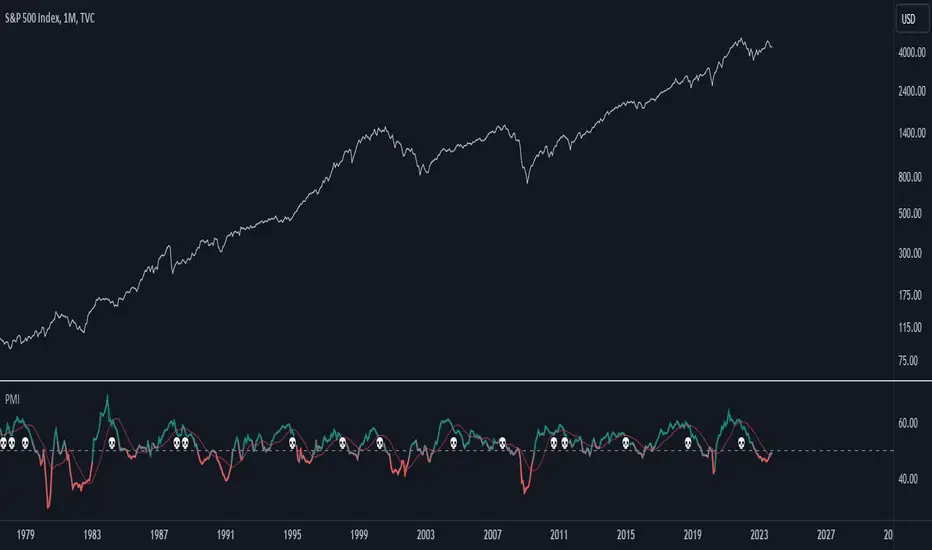
Purchasing Managers Index (PMI)The Purchasing Managers Index (PMI) is a widely recognized economic indicator that provides crucial insights into the health and performance of an economy's manufacturing and services sectors. This index is a vital tool for anticipating economic developments and trends, offering an early warning system for changes in these sectors.
The PMI is calculated based on surveys conducted among purchasing managers in various businesses and organizations. These managers are asked about their perceptions of current business conditions and their expectations for future economic activity within their sectors. The responses are then compiled and used to calculate the PMI value.
A PMI value above 50 typically indicates that the manufacturing or services sector is expanding, suggesting a positive economic outlook. Conversely, a PMI value below 50 suggests contraction, which may be an early indication of economic challenges or a potential recession.
In summary, the Purchasing Managers Index (PMI) is an essential economic indicator that assesses the health of manufacturing and services sectors by surveying purchasing managers' opinions. It serves as an early warning system for changes in economic activity and is a valuable tool for forecasting economic trends and potential crises.
This code combines the Purchasing Managers Index (PMI) data with two Simple Moving Averages (SMA) and some visual elements.
Let's break down how this indicator works:
1. Loading PMI Data:
The indicator loads data for the "USBCOI" symbol, which represents the PMI data. It fetches the monthly closing prices of this symbol.
2. Calculating Moving Averages:
Two Simple Moving Averages (SMAs) are calculated based on the PMI data. The first SMA, sma_usbcoi, has a length defined by the input parameter (default: 2). The second SMA, sma2_usbcoi, has a different length defined by the second input parameter (default: 14).
3. Color Coding and Thresholds:
The line color of the PMI plot is determined based on the value of the PMI. If the PMI is above 52, the color is teal; if it's below 48, the color is red; otherwise, it's gray. These threshold values are often used to identify specific conditions in the PMI data.
4. Crossing Indicator:
A key feature of this indicator is to determine if the PMI crosses the first SMA (sma_usbcoi) from top to bottom while also being above the value of 52. This is indicated by the crossedUp variable. This condition suggests a specific situation where the PMI crosses a short-term moving average while indicating strength (above 52).
5. Visual Elements:
A "💀" skull emoji is defined as skullEmoji.
The PMI is plotted on the chart with color coding based on its value, as described earlier.
The two SMAs are also plotted on the chart.
When the crossedUp condition is met (PMI crosses the first SMA from top to bottom while above 52), a skull emoji (indicating potential danger) is plotted at the top of the indicator window.
RelativeVolatilityIndicator with Trend FilterGuide to the Relative Volatility Indicator with Trend Filter (RVI_TF)
Introduction
The Relative Volatility Indicator with Trend Filter (RVI_TF) aims to provide traders with a comprehensive tool to analyze market volatility and trend direction. This unique indicator combines volatility ratio calculations with a trend filter to help you make more informed trading decisions.
Key Components
Scaled Volatility Ratio: This measures the current market volatility relative to historical volatility and scales the values for better visualization.
Fast and Slow Moving Averages for Volatility: These provide a smoothed representation of the scaled volatility ratio, making it easier to spot trends in market volatility.
Trend Filter: An additional line representing a long-term Simple Moving Average (SMA) to help you identify the prevailing market trend.
User Inputs
Short and Long ATR Period: These allow you to define the length for calculating the Average True Range (ATR), used in the volatility ratio.
Short and Long StdDev Period: Periods for short-term and long-term standard deviation calculations.
Min and Max Volatility Ratio for Scaling: Scale the volatility ratio between these min and max values.
Fast and Slow SMA Period for Volatility Ratio: Periods for the fast and slow Simple Moving Averages of the scaled volatility ratio.
Trend Filter Period: Period for the long-term SMA, used in the trend filter.
Show Trend Filter: Toggle to show/hide the trend filter line.
Trend Filter Opacity: Adjust the opacity of the trend filter line.
Visual Components
Histogram: The scaled volatility ratio is displayed as a histogram. It changes color based on the ratio value.
Fast and Slow Moving Averages: These are plotted over the histogram for additional context.
Trend Filter Line: Shown when the corresponding toggle is enabled, this line gives an indication of the general market trend.
How to Use
Volatility Analysis: Look for divergences between the fast and slow MAs of the scaled volatility ratio. It can signal potential reversals or continuation of trends.
Trend Confirmation: Use the Trend Filter line to confirm the direction of the current trend.
Conclusion
The RVI_TF is a multi-faceted indicator designed for traders who seek to integrate both volatility and trend analysis into their trading strategies. By providing a clearer understanding of market conditions, this indicator can be a valuable asset in a trader's toolkit.

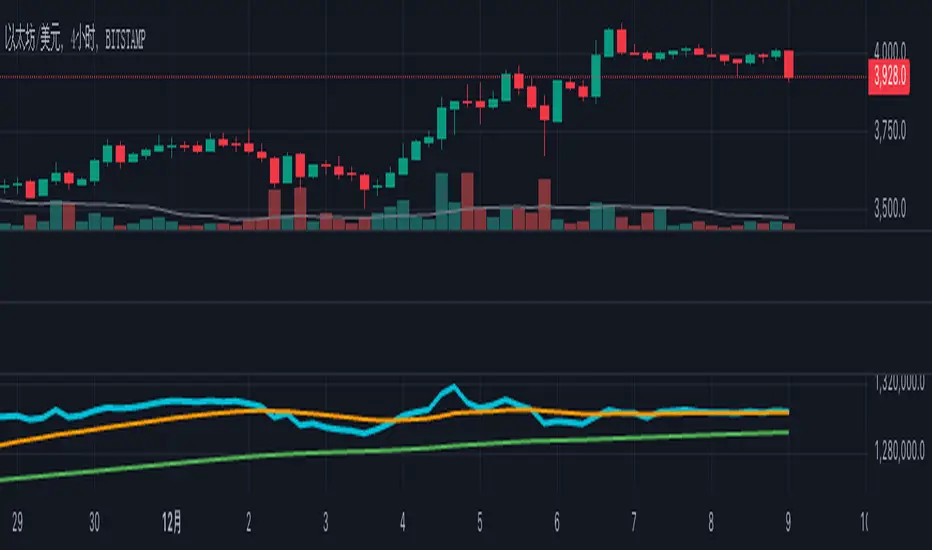
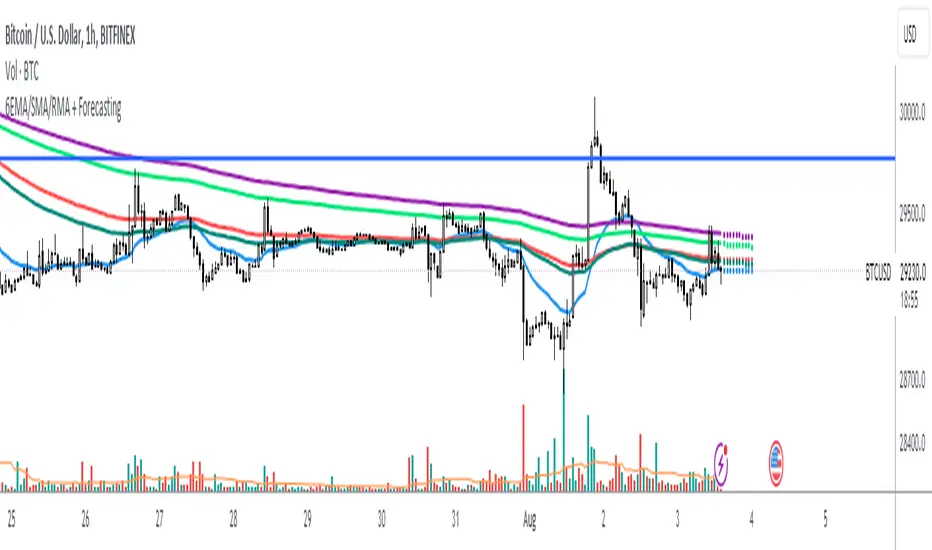
6 EMA/SMA/RMA + Forecasting 10 candles 6EMA/SMA/RMA + Forecasting 10 candles
The script allows the user to choose between different types of moving averages (SMA, EMA, RMA) using the soft_func_choice input.
The user can also choose between two types of forecasting: "Repetition" or "Linear Regression" using the type_of_forecast input.
For the linear regression forecast, the user can specify the number of candles to use in the linear regression calculation using the Linreglen input.
First Moving Average (MA) Calculation:
The script calculates the first MA based on the selected type (SMA, EMA, RMA) and plots it on the chart.
The user can customize the length and source of data for this MA.
If the selected forecast type is "Repetition," the script also calculates additional offset values for different repetitions of the MA.
Forecasting and Offset Calculation:
Depending on the chosen forecast type, the script calculates additional offset values for the MA. These offsets are used to forecast the future values of the MA.
The script calculates offsets for up to five repetitions (offset1, offset2, ..., offset5) for each MA.
If the forecast type is "Linear Regression," the script combines the MA's historical values with linear regression predictions to generate the forecasted values.
Plotting Additional Moving Averages:
The script allows the user to plot up to four additional MAs (Second MA, Third MA, Fourth MA, Fifth MA) with similar customizable settings for length and source of data.
Forecast Repetition:
If the forecast type is "Repetition," the script iterates through historical data and accumulates offset values, effectively simulating a repeated forecasting approach.
This repetition is controlled by a loop that adjusts the offset values based on historical price data.
Overall, this script provides a versatile tool for analyzing and forecasting multiple moving averages using various methods, allowing traders and analysts to experiment with different MA types and forecast strategies on their chosen price series.
MultiMovesCombines 3 different moving averages together with the linear regression. The moving averages are the HMA, EMA, and SMA. The script makes use of two different lengths to allow the end user to utilize common crossovers in order to determine entry into a trade. The edge of each "cloud" is where each of the moving averages actually are. The bar color is the average of the shorter length combined moving averages.
-The Hull Moving Average (HMA), developed by Alan Hull, is an extremely fast and smooth moving average. In fact, the HMA almost eliminates lag altogether and manages to improve smoothing at the same time. A longer period HMA may be used to identify trend.
-The exponential moving average (EMA) is a technical chart indicator that tracks the price of an investment (like a stock or commodity) over time. The EMA is a type of weighted moving average (WMA) that gives more weighting or importance to recent price data.
-A simple moving average (SMA) is an arithmetic moving average calculated by adding recent prices and then dividing that figure by the number of time periods in the calculation average.
-The Linear Regression Indicator plots the ending value of a Linear Regression Line for a specified number of bars; showing, statistically, where the price is expected to be. Instead of plotting an average of past price action, it is plotting where a Linear Regression Line would expect the price to be, making the Linear Regression Indicator more responsive than a moving average.
The lighter colors = default 50 MA
The darker colors = default 200 MA

peacefulIndicatorsWe are delighted to present the PeacefulIndicators library, a modest yet powerful collection of custom technical indicators created to enhance your trading analysis. The library features an array of practical tools, including MACD with Dynamic Length, Stochastic RSI with ATR Stop Loss, Bollinger Bands with RSI Divergence, and more.
The PeacefulIndicators library offers the following functions:
macdDynamicLength: An adaptive version of the classic MACD indicator, which adjusts the lengths of the moving averages based on the dominant cycle period, providing a more responsive signal.
rsiDivergence: A unique implementation of RSI Divergence detection that identifies potential bullish and bearish divergences using a combination of RSI and linear regression.
trendReversalDetection: A helpful tool for detecting trend reversals using the Rate of Change (ROC) and Moving Averages, offering valuable insights into possible market shifts.
volume_flow_oscillator: A custom oscillator that combines price movement strength and volume to provide a unique perspective on market dynamics.
weighted_volatility_oscillator: Another custom oscillator that factors in price volatility and volume to deliver a comprehensive view of market fluctuations.
rvo: The Relative Volume Oscillator highlights changes in volume relative to historical averages, helping to identify potential breakouts or reversals.
acb: The Adaptive Channel Breakout indicator combines a moving average with an adjustable volatility multiplier to create dynamic channels, useful for identifying potential trend shifts.
We hope this library proves to be a valuable addition to your trading toolbox.
Library "peacefulIndicators"
A custom library of technical indicators for trading analysis, including MACD with Dynamic Length, Stochastic RSI with ATR Stop Loss, Bollinger Bands with RSI Divergence, and more.
macdDynamicLength(src, shortLen, longLen, signalLen, dynLow, dynHigh)
Moving Average Convergence Divergence with Dynamic Length
Parameters:
src (float) : Series to use
shortLen (int) : Shorter moving average length
longLen (int) : Longer moving average length
signalLen (int) : Signal line length
dynLow (int) : Lower bound for the dynamic length
dynHigh (int) : Upper bound for the dynamic length
Returns: tuple of MACD line and Signal line
Computes MACD using lengths adapted based on the dominant cycle period
rsiDivergence(src, rsiLen, divThreshold, linRegLength)
RSI Divergence Detection
Parameters:
src (float) : Series to use
rsiLen (simple int) : Length for RSI calculation
divThreshold (float) : Divergence threshold for RSI
linRegLength (int) : Length for linear regression calculation
Returns: tuple of RSI Divergence (positive, negative)
Computes RSI Divergence detection that identifies bullish (positive) and bearish (negative) divergences
trendReversalDetection(src, rocLength, maLength, maType)
Trend Reversal Detection (TRD)
Parameters:
src (float) : Series to use
rocLength (int) : Length for Rate of Change calculation
maLength (int) : Length for Moving Average calculation
maType (string) : Type of Moving Average to use (default: "sma")
Returns: A tuple containing trend reversal direction and the reversal point
Detects trend reversals using the Rate of Change (ROC) and Moving Averages.
volume_flow_oscillator(src, length)
Volume Flow Oscillator
Parameters:
src (float) : Series to use
length (int) : Period for the calculation
Returns: Custom Oscillator value
Computes the custom oscillator based on price movement strength and volume
weighted_volatility_oscillator(src, length)
Weighted Volatility Oscillator
Parameters:
src (float) : Series to use
length (int) : Period for the calculation
Returns: Custom Oscillator value
Computes the custom oscillator based on price volatility and volume
rvo(length)
Relative Volume Oscillator
Parameters:
length (int) : Period for the calculation
Returns: Custom Oscillator value
Computes the custom oscillator based on relative volume
acb(price_series, ma_length, vol_length, multiplier)
Adaptive Channel Breakout
Parameters:
price_series (float) : Price series to use
ma_length (int) : Period for the moving average calculation
vol_length (int) : Period for the volatility calculation
multiplier (float) : Multiplier for the volatility
Returns: Tuple containing the ACB upper and lower values and the trend direction (1 for uptrend, -1 for downtrend)

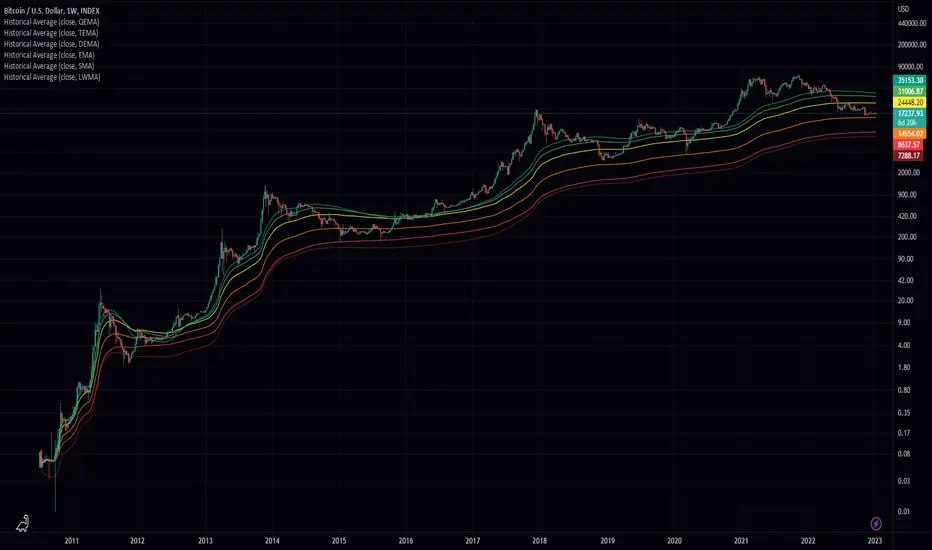
Historical AverageHistorical Average is a script written in the Pine Script language and is used to calculate various types of moving averages. Moving averages are statistical measures that smooth out data over time, making it easier to identify trends and patterns. This script allows the user to select from several different types of moving averages, including Simple Moving Average (SMA), Linear Weighted Moving Average (LWMA), Exponential Moving Average (EMA), Double Exponential Moving Average (DEMA), Triple Exponential Moving Average (TEMA), and Quadruple Exponential Moving Average (QEMA). The script also allows the user to specify a data source for the moving averages to be calculated from.
To use this script, the user simply needs to specify the data source and select the desired moving average type from the list. The script will then calculate and plot the selected moving average on the chart. This can be useful for traders and investors who want to gain a better understanding of the trends and patterns in the data they are analyzing.
Adaptive Oscillator constructor [lastguru]Adaptive Oscillators use the same principle as Adaptive Moving Averages. This is an experiment to separate length generation from oscillators, offering multiple alternatives to be combined. Some of the combinations are widely known, some are not. Note that all Oscillators here are normalized to -1..1 range. This indicator is based on my previously published public libraries and also serve as a usage demonstration for them. I will try to expand the collection (suggestions are welcome), however it is not meant as an encyclopaedic resource , so you are encouraged to experiment yourself: by looking on the source code of this indicator, I am sure you will see how trivial it is to use the provided libraries and expand them with your own ideas and combinations. I give no recommendation on what settings to use, but if you find some useful setting, combination or application ideas (or bugs in my code), I would be happy to read about them in the comments section.
The indicator works in three stages: Prefiltering, Length Adaptation and Oscillators.
Prefiltering is a fast smoothing to get rid of high-frequency (2, 3 or 4 bar) noise.
Adaptation algorithms are roughly subdivided in two categories: classic Length Adaptations and Cycle Estimators (they are also implemented in separate libraries), all are selected in Adaptation dropdown. Length Adaptation used in the Adaptive Moving Averages and the Adaptive Oscillators try to follow price movements and accelerate/decelerate accordingly (usually quite rapidly with a huge range). Cycle Estimators, on the other hand, try to measure the cycle period of the current market, which does not reflect price movement or the rate of change (the rate of change may also differ depending on the cycle phase, but the cycle period itself usually changes slowly).
Chande (Price) - based on Chande's Dynamic Momentum Index (CDMI or DYMOI), which is dynamic RSI with this length
Chande (Volume) - a variant of Chande's algorithm, where volume is used instead of price
VIDYA - based on VIDYA algorithm. The period oscillates from the Lower Bound up (slow)
VIDYA-RS - based on Vitali Apirine's modification of VIDYA algorithm (he calls it Relative Strength Moving Average). The period oscillates from the Upper Bound down (fast)
Kaufman Efficiency Scaling - based on Efficiency Ratio calculation originally used in KAMA
Deviation Scaling - based on DSSS by John F. Ehlers
Median Average - based on Median Average Adaptive Filter by John F. Ehlers
Fractal Adaptation - based on FRAMA by John F. Ehlers
MESA MAMA Alpha - based on MESA Adaptive Moving Average by John F. Ehlers
MESA MAMA Cycle - based on MESA Adaptive Moving Average by John F. Ehlers , but unlike Alpha calculation, this adaptation estimates cycle period
Pearson Autocorrelation* - based on Pearson Autocorrelation Periodogram by John F. Ehlers
DFT Cycle* - based on Discrete Fourier Transform Spectrum estimator by John F. Ehlers
Phase Accumulation* - based on Dominant Cycle from Phase Accumulation by John F. Ehlers
Length Adaptation usually take two parameters: Bound From (lower bound) and To (upper bound). These are the limits for Adaptation values. Note that the Cycle Estimators marked with asterisks(*) are very computationally intensive, so the bounds should not be set much higher than 50, otherwise you may receive a timeout error (also, it does not seem to be a useful thing to do, but you may correct me if I'm wrong).
The Cycle Estimators marked with asterisks(*) also have 3 checkboxes: HP (Highpass Filter), SS (Super Smoother) and HW (Hann Window). These enable or disable their internal prefilters, which are recommended by their author - John F. Ehlers . I do not know, which combination works best, so you can experiment.
Chande's Adaptations also have 3 additional parameters: SD Length (lookback length of Standard deviation), Smooth (smoothing length of Standard deviation) and Power ( exponent of the length adaptation - lower is smaller variation). These are internal tweaks for the calculation.
Oscillators section offer you a choice of Oscillator algorithms:
Stochastic - Stochastic
Super Smooth Stochastic - Super Smooth Stochastic (part of MESA Stochastic) by John F. Ehlers
CMO - Chande Momentum Oscillator
RSI - Relative Strength Index
Volume-scaled RSI - my own version of RSI. It scales price movements by the proportion of RMS of volume
Momentum RSI - RSI of price momentum
Rocket RSI - inspired by RocketRSI by John F. Ehlers (not an exact implementation)
MFI - Money Flow Index
LRSI - Laguerre RSI by John F. Ehlers
LRSI with Fractal Energy - a combo oscillator that uses Fractal Energy to tune LRSI gamma
Fractal Energy - Fractal Energy or Choppiness Index by E. W. Dreiss
Efficiency ratio - based on Kaufman Adaptive Moving Average calculation
DMI - Directional Movement Index (only ADX is drawn)
Fast DMI - same as DMI, but without secondary smoothing
If no Adaptation is selected (None option), you can set Length directly. If an Adaptation is selected, then Cycle multiplier can be set.
Before an Oscillator, a High Pass filter may be executed to remove cyclic components longer than the provided Highpass Length (no High Pass filter, if Highpass Length = 0). Both before and after the Oscillator a Moving Average can be applied. The following Moving Averages are included: SMA, RMA, EMA, HMA , VWMA, 2-pole Super Smoother, 3-pole Super Smoother, Filt11, Triangle Window, Hamming Window, Hann Window, Lowpass, DSSS. For more details on these Moving Averages, you can check my other Adaptive Constructor indicator:
The Oscillator output may be renormalized and postprocessed with the following Normalization algorithms:
Stochastic - Stochastic
Super Smooth Stochastic - Super Smooth Stochastic (part of MESA Stochastic) by John F. Ehlers
Inverse Fisher Transform - Inverse Fisher Transform
Noise Elimination Technology - a simplified Kendall correlation algorithm "Noise Elimination Technology" by John F. Ehlers
Except for Inverse Fisher Transform, all Normalization algorithms can have Length parameter. If it is not specified (set to 0), then the calculated Oscillator length is used.
More information on the algorithms is given in the code for the libraries used. I am also very grateful to other TradingView community members (they are also mentioned in the library code) without whom this script would not have been possible.

Adaptive MA constructor [lastguru]Adaptive Moving Averages are nothing new, however most of them use EMA as their MA of choice once the preferred smoothing length is determined. I have decided to make an experiment and separate length generation from smoothing, offering multiple alternatives to be combined. Some of the combinations are widely known, some are not. This indicator is based on my previously published public libraries and also serve as a usage demonstration for them. I will try to expand the collection (suggestions are welcome), however it is not meant as an encyclopaedic resource, so you are encouraged to experiment yourself: by looking on the source code of this indicator, I am sure you will see how trivial it is to use the provided libraries and expand them with your own ideas and combinations. I give no recommendation on what settings to use, but if you find some useful setting, combination or application ideas (or bugs in my code), I would be happy to read about them in the comments section.
The indicator works in three stages: Prefiltering, Length Adaptation and Moving Averages.
Prefiltering is a fast smoothing to get rid of high-frequency (2, 3 or 4 bar) noise.
Adaptation algorithms are roughly subdivided in two categories: classic Length Adaptations and Cycle Estimators (they are also implemented in separate libraries), all are selected in Adaptation dropdown. Length Adaptation used in the Adaptive Moving Averages and the Adaptive Oscillators try to follow price movements and accelerate/decelerate accordingly (usually quite rapidly with a huge range). Cycle Estimators, on the other hand, try to measure the cycle period of the current market, which does not reflect price movement or the rate of change (the rate of change may also differ depending on the cycle phase, but the cycle period itself usually changes slowly).
Chande (Price) - based on Chande's Dynamic Momentum Index (CDMI or DYMOI), which is dynamic RSI with this length
Chande (Volume) - a variant of Chande's algorithm, where volume is used instead of price
VIDYA - based on VIDYA algorithm. The period oscillates from the Lower Bound up (slow)
VIDYA-RS - based on Vitali Apirine's modification of VIDYA algorithm (he calls it Relative Strength Moving Average). The period oscillates from the Upper Bound down (fast)
Kaufman Efficiency Scaling - based on Efficiency Ratio calculation originally used in KAMA
Deviation Scaling - based on DSSS by John F. Ehlers
Median Average - based on Median Average Adaptive Filter by John F. Ehlers
Fractal Adaptation - based on FRAMA by John F. Ehlers
MESA MAMA Alpha - based on MESA Adaptive Moving Average by John F. Ehlers
MESA MAMA Cycle - based on MESA Adaptive Moving Average by John F. Ehlers, but unlike Alpha calculation, this adaptation estimates cycle period
Pearson Autocorrelation* - based on Pearson Autocorrelation Periodogram by John F. Ehlers
DFT Cycle* - based on Discrete Fourier Transform Spectrum estimator by John F. Ehlers
Phase Accumulation* - based on Dominant Cycle from Phase Accumulation by John F. Ehlers
Length Adaptation usually take two parameters: Bound From (lower bound) and To (upper bound). These are the limits for Adaptation values. Note that the Cycle Estimators marked with asterisks(*) are very computationally intensive, so the bounds should not be set much higher than 50, otherwise you may receive a timeout error (also, it does not seem to be a useful thing to do, but you may correct me if I'm wrong).
The Cycle Estimators marked with asterisks(*) also have 3 checkboxes: HP (Highpass Filter), SS (Super Smoother) and HW (Hann Window). These enable or disable their internal prefilters, which are recommended by their author - John F. Ehlers. I do not know, which combination works best, so you can experiment.
Chande's Adaptations also have 3 additional parameters: SD Length (lookback length of Standard deviation), Smooth (smoothing length of Standard deviation) and Power (exponent of the length adaptation - lower is smaller variation). These are internal tweaks for the calculation.
Length Adaptaton section offer you a choice of Moving Average algorithms. Most of the Adaptations are originally used with EMA, so this is a good starting point for exploration.
SMA - Simple Moving Average
RMA - Running Moving Average
EMA - Exponential Moving Average
HMA - Hull Moving Average
VWMA - Volume Weighted Moving Average
2-pole Super Smoother - 2-pole Super Smoother by John F. Ehlers
3-pole Super Smoother - 3-pole Super Smoother by John F. Ehlers
Filt11 -a variant of 2-pole Super Smoother with error averaging for zero-lag response by John F. Ehlers
Triangle Window - Triangle Window Filter by John F. Ehlers
Hamming Window - Hamming Window Filter by John F. Ehlers
Hann Window - Hann Window Filter by John F. Ehlers
Lowpass - removes cyclic components shorter than length (Price - Highpass)
DSSS - Derivation Scaled Super Smoother by John F. Ehlers
There are two Moving Averages that are drown on the chart, so length for both needs to be selected. If no Adaptation is selected ( None option), you can set Fast Length and Slow Length directly. If an Adaptation is selected, then Cycle multiplier can be selected for Fast and Slow MA.
More information on the algorithms is given in the code for the libraries used. I am also very grateful to other TradingView community members (they are also mentioned in the library code) without whom this script would not have been possible.

Configurable Multi MA Crossover Voting SystemThis strategy goes long when all fast moving averages that you have defined are above their counterpart slow moving averages.
Long position is closed when profit or loss target is hit and at least one of the fast moving averages is below its counterpart slow moving average.
The format of the config is simple. The format is : FASTxSLOW,FASTxSLOW,...
Example : If you want 2 moving averages fast=9,slow=14 and fast=20,slow=50 you define it like this : 9x14,20x50
Another example : 5x10,10x15,15x20 => means 3 moving average setups : first wih fast=5/slow=10, second with fast=10/slow=15, last with fast=15/slow=20
You can chose the type of moving average : SMA, WMA, VWMA (i got issues with EMA/RMA so i removed them)
You can chose the source of the moving average : high, close, hl2 etc.
You can chose the period on which ATR is calculated and ATR profit/loss factors.
Profit is calculated like : buy_price + atr_factor*atr
Loss is calculated like : buy_price - atr_factor*atr
Performance in backtest is variable depending on the timeframe, the options and the market.
Performance in backtest suggests it works better for higher timeframes like 1d, 4h etc.
Disclaimer
Please remember that past performance may not be indicative of future results.
Due to various factors, including changing market conditions, the strategy may no longer perform as well as in historical backtesting.
This post and the script don’t provide any financial advice.

Moving Average MultitoolI made this script as a personal tool while backtesting multiple moving averages. It allows you to easily access and switch between different types of moving averages, without having to continuously add and remove different moving averages from your chart.
It also has the option to show the a 14 period average distance between the closing price of an asset and the selected moving average, as a multiple of ATR. This number can be shown by enabling the "Show ATR Between MA and Close" setting. The intention of this value is to quantify and compare the speed of different moving averages across any instrument and any timeframe. The higher the value, the slower the moving average. The lower the value, the faster the moving average.
